Projects
In the summer of 2020, I took a GIS course based in R. I wrote some code, and did some cool data science. Here is a collection of links!
Lab 1: Data Science Workflows
In this assignment we built a static users site with Github pages
I learned how to apply knowledge from previous activities to create files within my project
Familiarized myself with functions in Rstudio
Learned how to insert a picture and icons on RMarkdown
Lab 2: Data Wrangling
In this lab we practiced data wrangling and visualization skills.
We used COVID-19 data from the New York Times, to determine the COVID conditions at a county level
We were introduced to new libraries such as readxl, to read in data, and zoo, to determine things like the rolling mean of any given data.

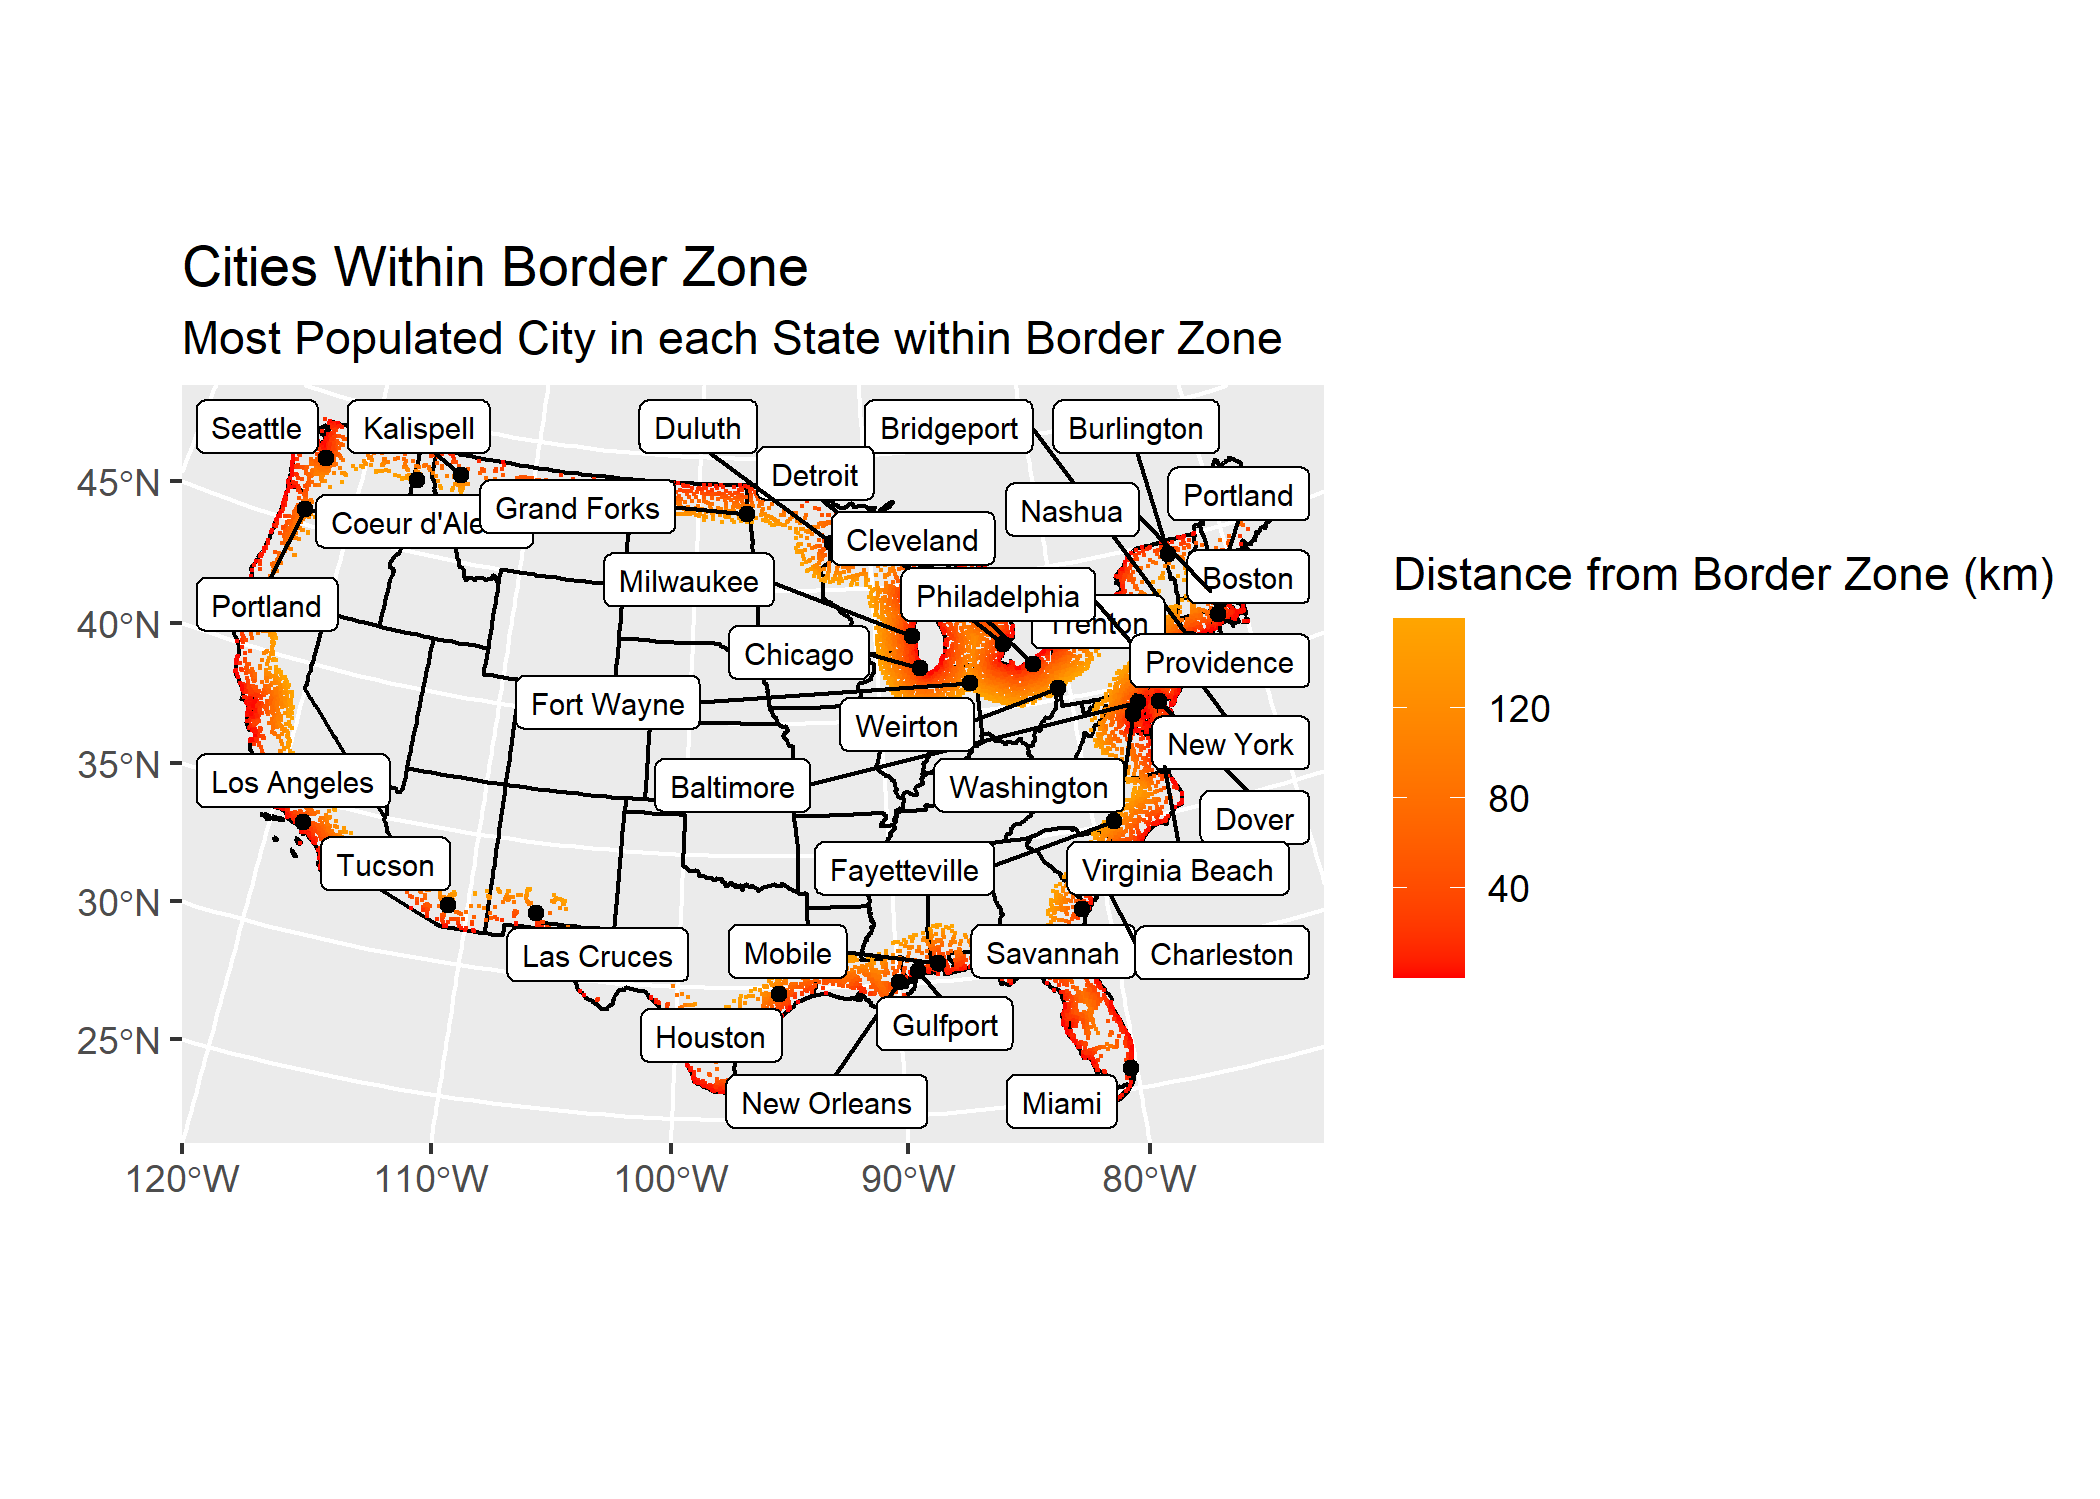
Lab 3: Projections, Distances, and Mapping
In this lab we were introduced to sf, sfc, and sfg features and objects.
I learned how to install github libraries that would allow us to read in US boundary data.
I learned how to further edit our gg plots to be more descriptive of the data we are representing.

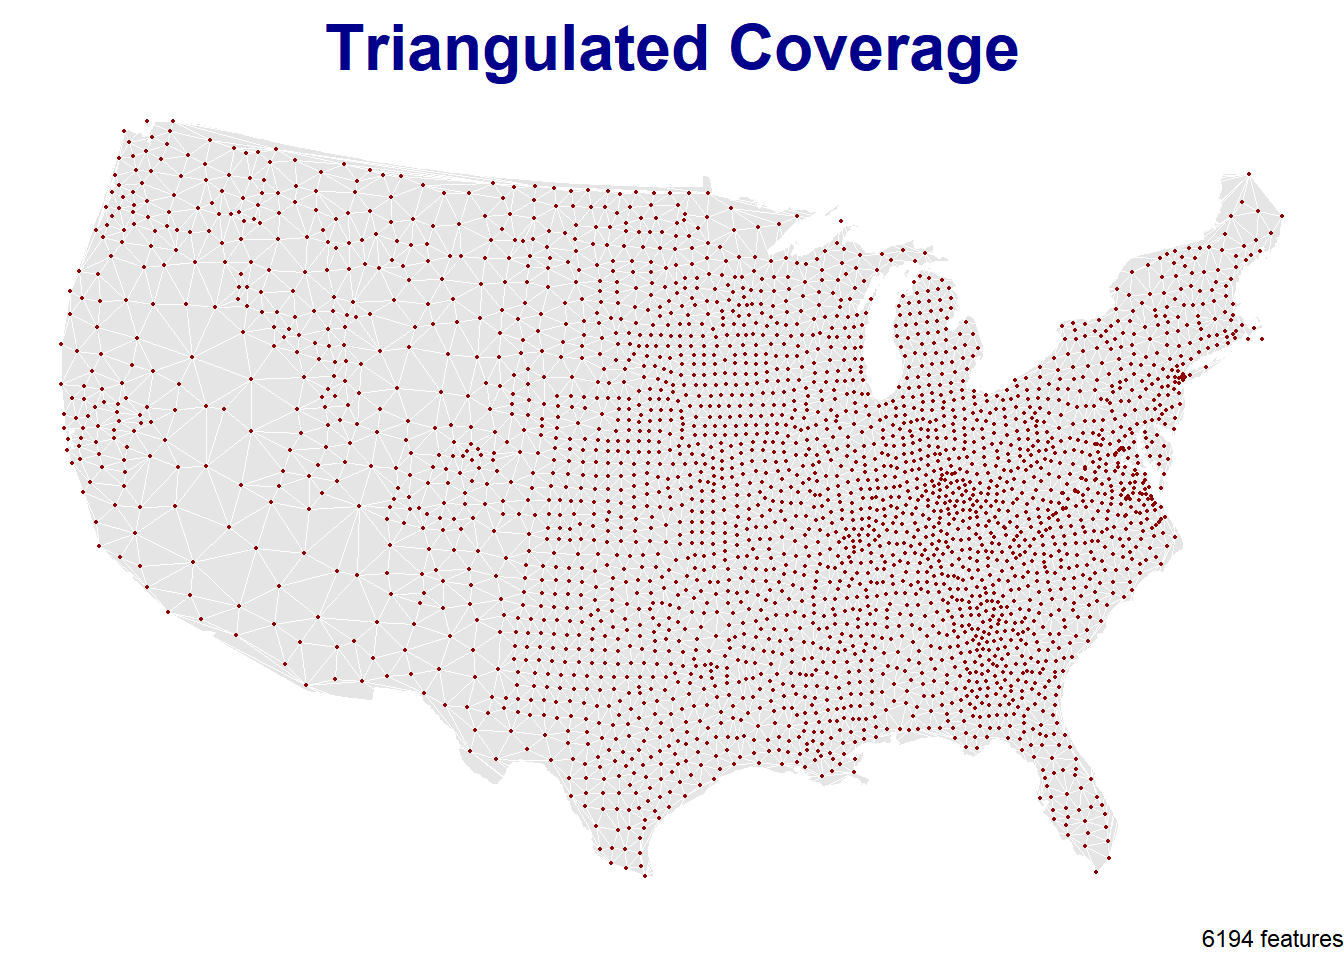
Lab 4: Tesselations, Spatial Joins, and Point-in-Polygon
I learned how to write functions to expedite tasks.
I learned how to tesselate surfaces for our county data.
This was one of the more challenging labs for me but helped me better understand the basis of functions.

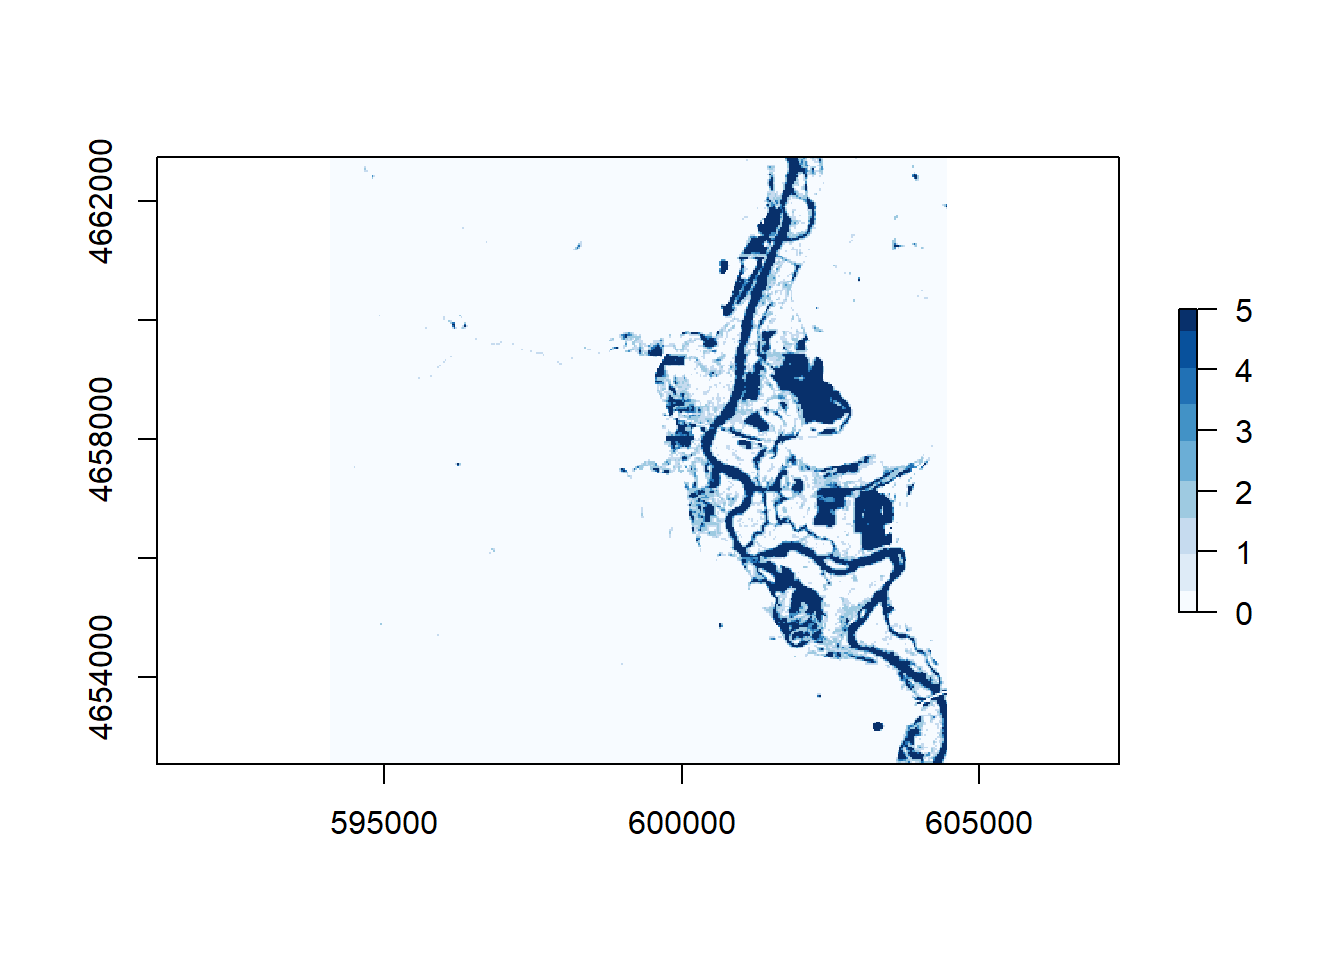
Lab 5: Raster Analysis
I learned how to identify an AOI for out data.
We were introduced to the getlandsat package in R, to import satellite images into our code.
I learned how to use bands to find which combination best represents or AOI and data.
I learned how to extract data and create tif files.

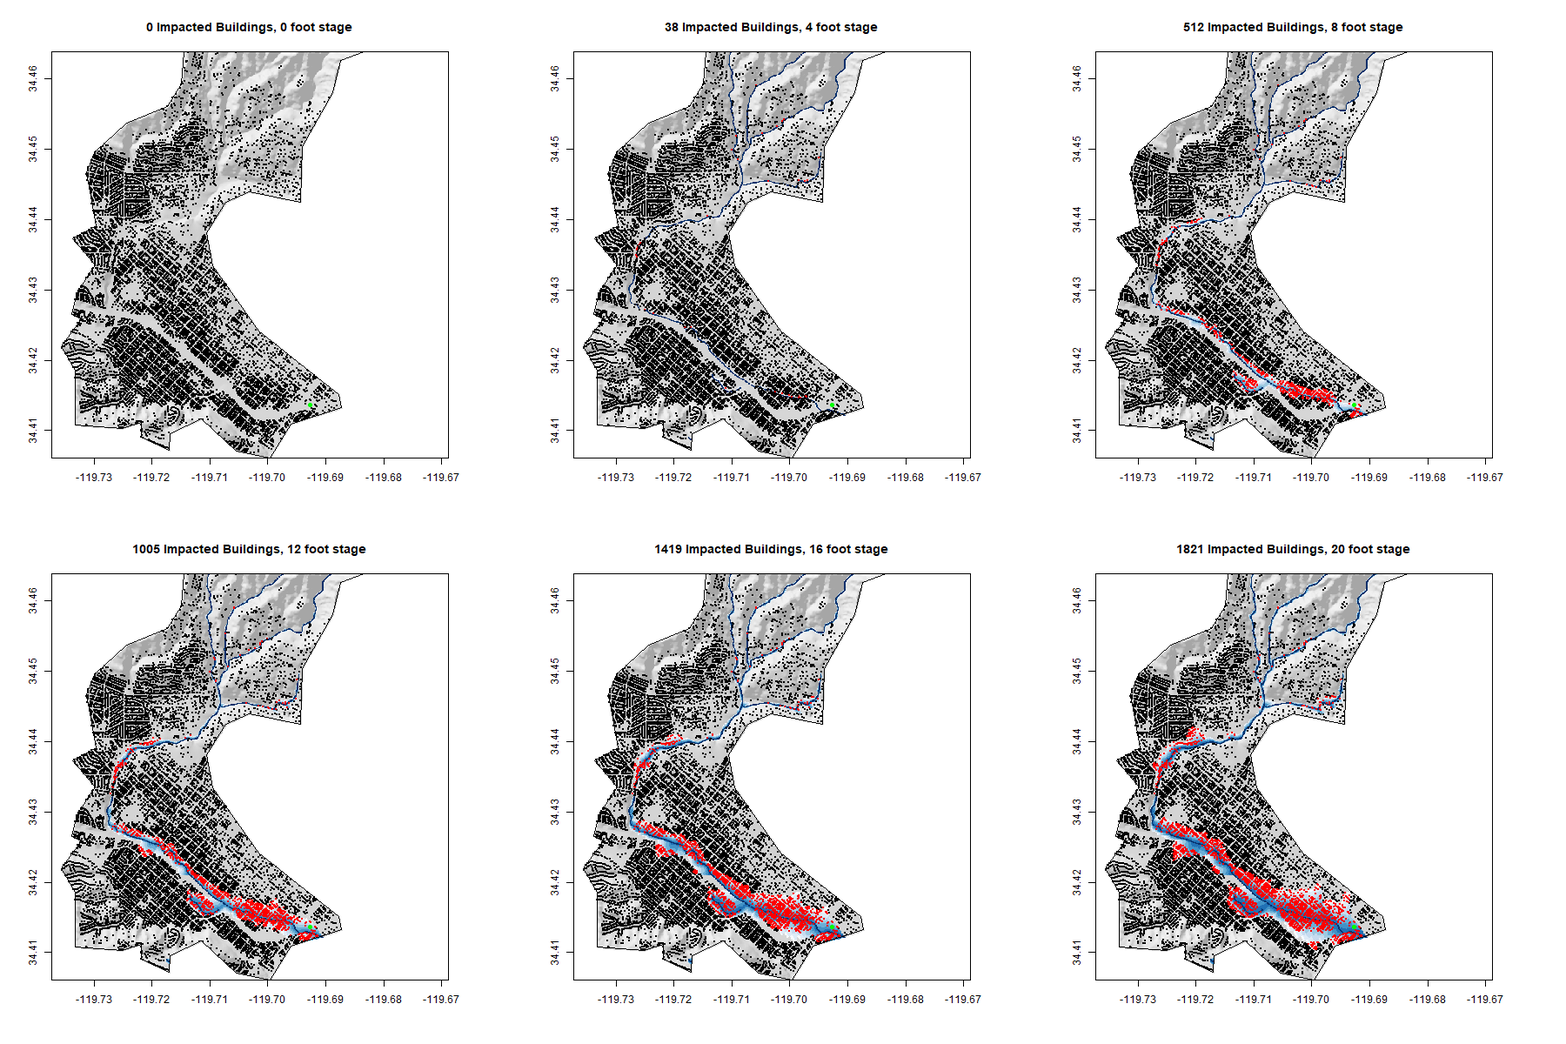
Lab 6: Terrain Analysis
I learned how to layer different types of data (raster/vector), to create descriptive maps showing live data.
I learned how to create a gif file.
I applied my knowledge from past labs to and effectively used them in lab 6 to create Flood Inundation Map
